Climatology
To quantify how representative our model climatology is of reality, the model climatology was compared to the co-located observational climatology. Time series comparisons are presented at the locations of two Olympic Coast National Marine Sanctuary (OCNMS) moorings on the Washington shelf (CE042, CE015) as well as three profiles along the Newport line from the inner, mid, and outer shelf of Oregon. The moorings were deployed during a portion of the year, and so the comparisons between climatologies are limited to the period the observations were available (May through October). The OCNMS mooring records were averaged over 2004 - 2014 for temperature and 2006 - 2014 for oxygen.
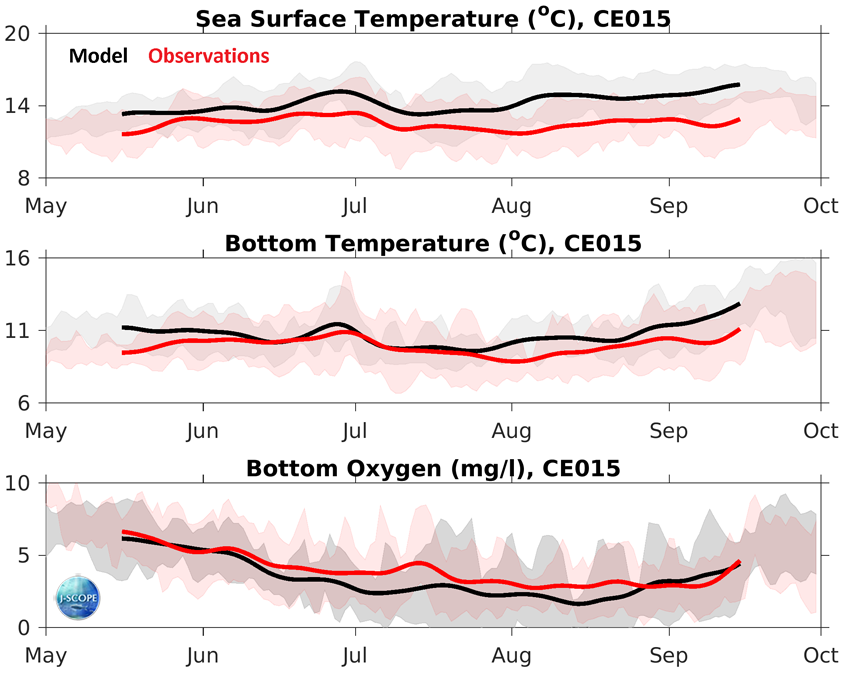
Time series of the observational climatology (red) from the OCNMS mooring location, CE015, off the Washington shelf in 15 m of water. The model climatology (black) is the average of the 2009 - 2014 hindcasts. The time series have been smoothed with a 30-day filter. The standard deviation around each climatology is shaded in the background. Observations are in red and the model is in black. (a) SST, (b) bottom temperature, and (c) bottom oxygen (mg/l).
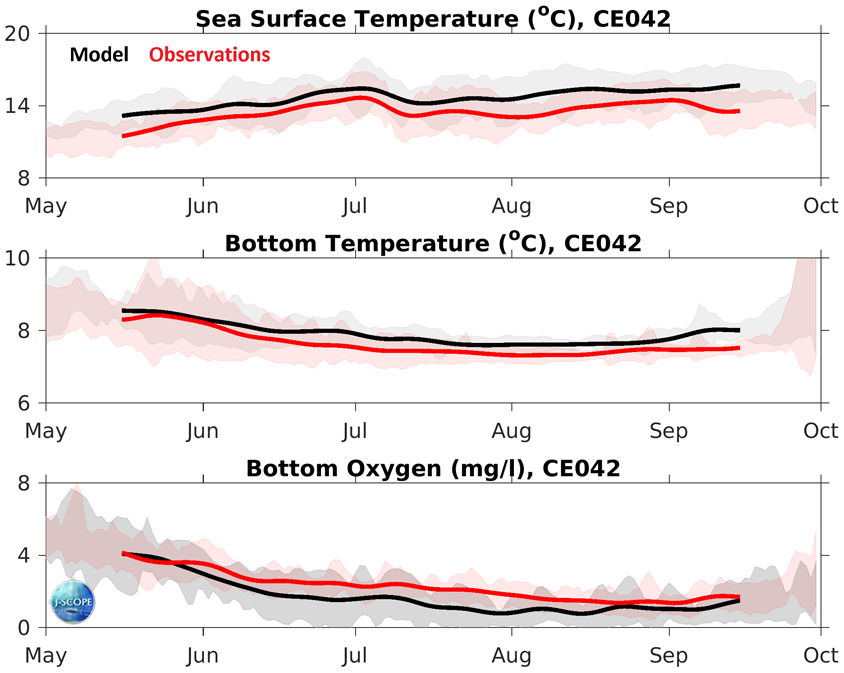
Time series of the observational climatology (red) from the OCNMS mooring location, CE042, off the Washington shelf in 42 m of water. The model climatology (black) is the average of the 2009 - 2014 hindcasts. The time series have been smoothed with a 30-day filter. The standard deviation around each climatology is shaded in the background. Observations are in red and the model is in black. (top) SST, (middle) bottom temperature, and (bottom) bottom oxygen (mg/l).
The Newport line observations are made bi-weekly year round and here we present CTD measurements of temperature and oxygen at three locations on the Oregon shelf: NH03, NH-10, and NH25. The model fields were extracted from the same location as the observations from each year, and then those time series were averaged together to make a model climatology for that location.
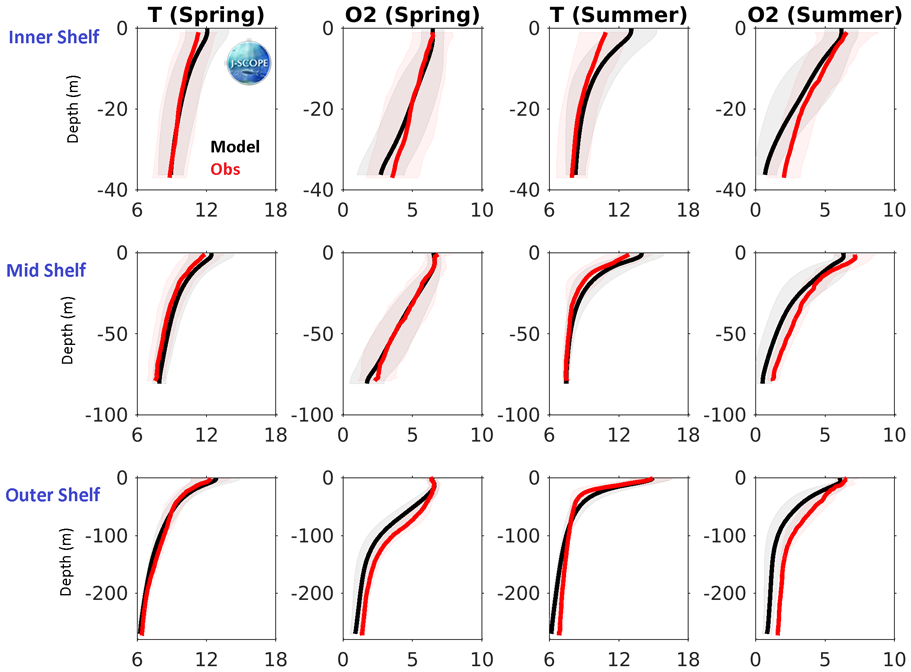
A comparison of model and observational climatologies from three locations (inner, mid, and outer shelf) along the Newport Line on the Oregon shelf. The model climatology (black) is the average of the 2009 - 2014 hindcasts, at each location and depth. The observational climatology (red) is based on twice-monthly samples. The standard deviation around each climatology is shaded in the background. Temperature and oxygen profiles are shown from Spring (April - June) and Summer (July - September).
