Climatology
The J-SCOPE climatology showcases the seasonal cycle for bottom oxygen in the region. The contour for near hypoxic conditions (white, 1.5 ml/l) is present on the shelf in this climatology during the upwelling season indicating hypoxic conditions occur every upwelling season during this climatology (2009 - 2014). The hypoxic contour is shallower (closer to the coast) in Oregon than it is in Washington.
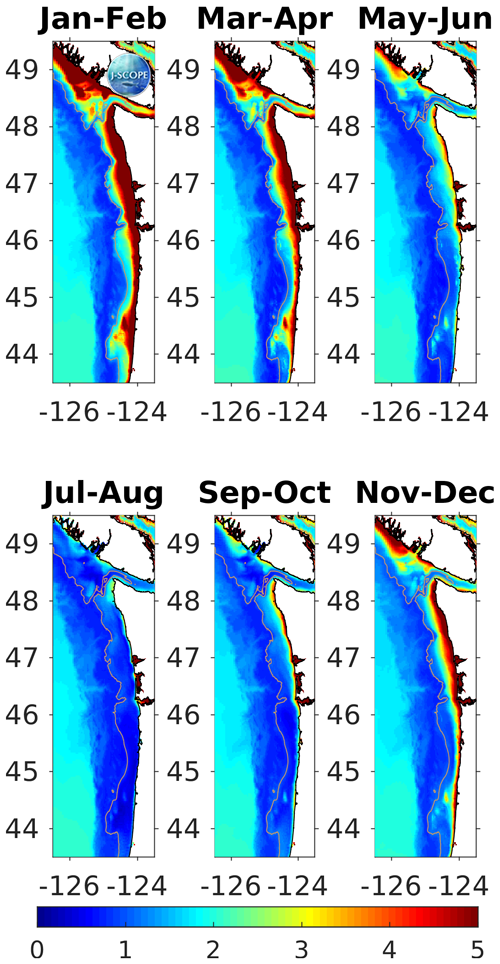
The model climatology spanning 2009 - 2014 for bottom oxygen (ml/l) of the model domain. Each panel details a two month average. The 200 meter isobath (the shelf break), and the hypoxic limit (white contour) are highlighted for reference.
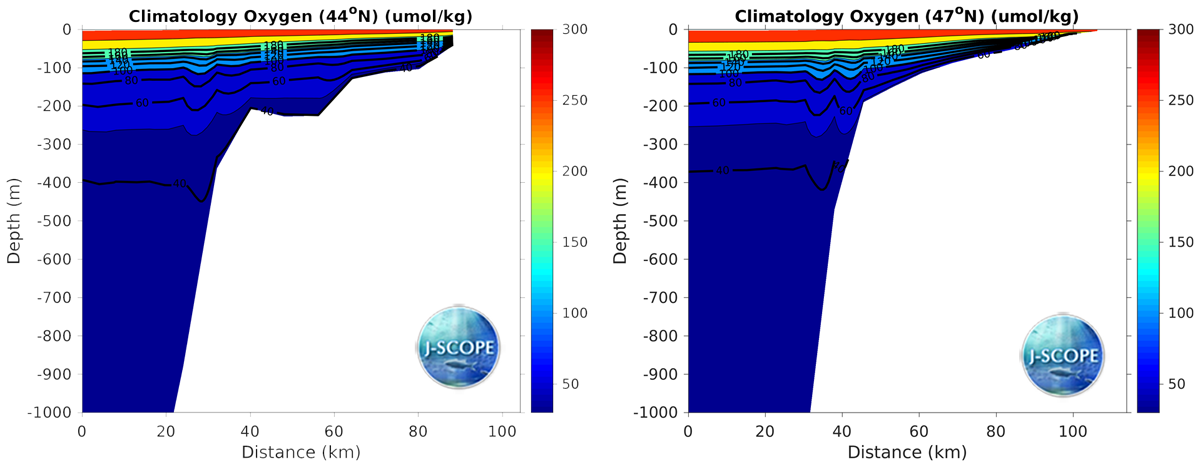
The model climatology spanning 2009 - 2014 for oxygen (umol/kg) from two cross sections (distance offshore vs depth) from the Washington shelf (Cape Elizabeth ~47 N) (right) and Oregon shelf (Heceta Bank ~44N) (left). The cross sections are averaged over the upwelling season (April - September).