Honshu Earthquake and Tsunami 2011
The Tsunami Evacuation Zones for the Washington and Oregon Coasts app was developed jointly by the Oregon Department of Geology and Mineral Industries (DOGAMI) and NANOOS. Based in Google Maps, this tool allows residents, planners, emergency responders, and others to see the extent of areas affected by both local (Cascadia subduction zone) and distant (outside of the immediate Pacific Northwest region) earthquakes and tsunamis. Inundation areas for Cannon Beach and the southern coast from Brookings to Bandon were recently updated, and this tool will be expanded to include Washington coastal areas within a year.
NANOOS saw traffic spike 400% on March 11th, the day of the Japan earthquake, with nearly all of that traffic directed towards the Oregon Tsunami Evacuation Zone application. Of the almost 500 page views, most of the visitors were from Washington, Oregon, and California, but we had visits from nearly every state, including Nebraska. Of the traffic, 76% visited directly (by either typing nanoos.org directly into the address bar or using a bookmark), 6.5% came from Google, 4% from Facebook, and 3.25% from IOOS.
The NANOOS Data Management and Communications (DMAC) team saw that this high traffic was resulting in frequent outages of the tsunami inundation zone application. The Geoserver that we had been using was not able to fulfill all of the data requests. In response to this, staff members moved the shape files to a more robust tile server housed at the Environmental & Information Systems Department at the Applied Physics Lab at the University of Washington. Future plans include making these shape files available through the NANOOS Visualization System (NVS).
The NANOOS Visualization System (NVS) is home to real-time data relevant to tsunamis, including surface currents and water height, as well as other information that is collected by sensors that are supported by a wide range of organizations, including the NOAA National Data Buoy Center (NDBC), NOAA National Ocean Service (NOS)/ Center for Operational Oceanographic Products and Services (CO-OPS), and NANOOS. Users can easily access these data that are collected from several locations in Washington, Oregon, and Northern California.
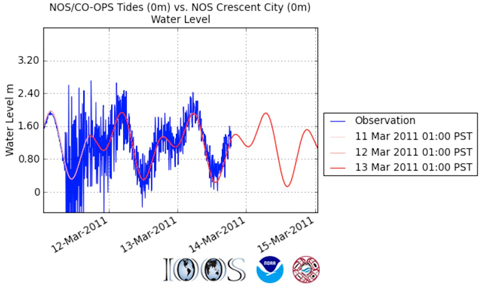
The NANOOS Facebook page was also used to get the message about the tsunami out broadly. Throughout March 11th with updates on March 14th, water level graphs from La Push, WA (northern/central coast), Garibaldi, OR (northern coast), Port Orford, OR (southern coast), and Crescent City, CA (northern coast), among other locales, were posted on the page. Both real-time data graphs and Comparator graphs, which show predicted model output and observed measurements on one graph, were posted. Resources from other organizations, including tsunami predictions and visualizations from the NOAA Pacific Marine Environmental Laboratory (PMEL) were also posted.
Other Resources
Oregon and Washington Earthquake and Tsunami Resources
Oregon DOGAMI Tsunami Information Clearinghouse
Washington Emergency Management
Washington Department of Natural Resources
Washington Tsunami Evacuation Map
Related to the March 11th Honshu Earthquake and Tsunami
United States Geological Survey (USGS)
National Oceanic and Atmospheric Administration Pacific Marine Environmental Lab (NOAA PMEL)
| National Observing System Partners NSF Ocean Observing Initiative (OOI) National Estuarine Research Reserve System (NERRS) Olympic Coast National Marine Sanctuary (OCNMS) National Data Buoy Center (NDBC) Coastal Data Information Program (CDIP) Integrated Ocean Observing System IOOS | |||||||