Lack of Oxygen? Hypoxia in Pacific Northwest Waters
Dead zones have formed in Hood Canal during the fall of 2002, 2003, 2004 and 2006. On this page, you can find the answers to the following questions:
- Where is Hood Canal and what does it look like?
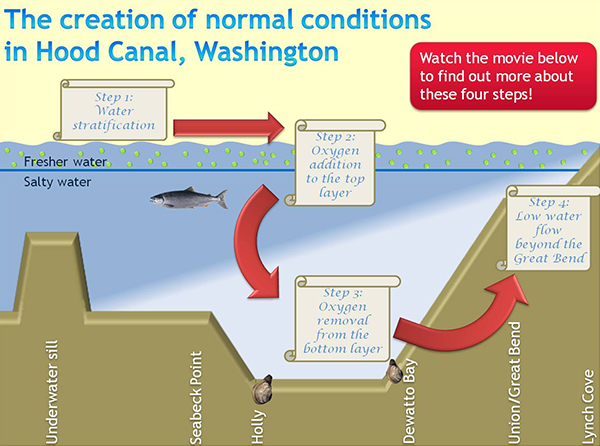
- What are the normal, long-term hypoxia conditions in the Canal? Watch the animation below to find out.
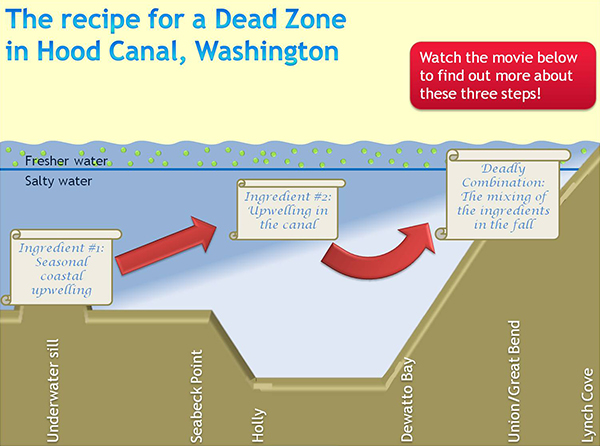
- How are Dead Zones in the Canal made? Watch the animation to learn more.
- Are there dead zones in the Hood Canal right now? Check out some data after the animations.
Where is the Hood Canal and what does it look like?

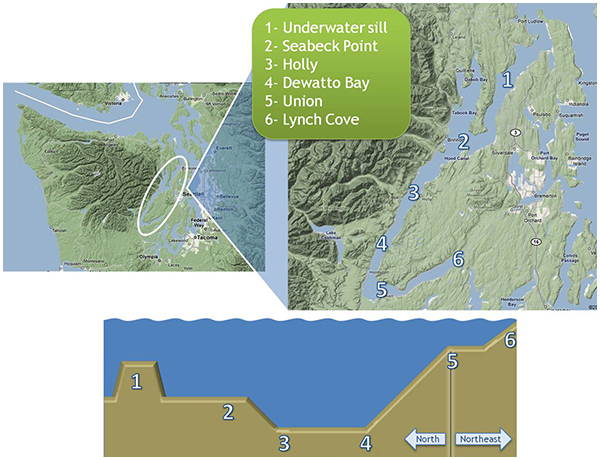
The Hood Canal is about 60 miles long and gets as deep as 600 feet. The diagram here relates features on land to important areas in the bathymetry.
Hood Canal Animation #1: Creation of normal conditions

Hood Canal Animation #2: Creation of dead zones

Are there dead zones in Hood Canal right now?
The Hood Canal Dissolved Oxygen Program (HCDOP) has been studying all aspects of Hood Canal to get a complete understanding of the factors that create dead zones in the Canal.
Oceanic Remote Chemical Analyzing (ORCA) buoys are currently recording dissolved oxygen in four different places in the Canal:
North of the Hood Canal Bridge - data from Winter 2005/2006 to present
Middle of the Canal near Holly - data from Fall 2006 to present
Just north of the Great Bend - data from Winter 2005/2006 to present
East of the Great Bend - data from Spring 2005 to present
| National Observing System Partners Alliance for Coastal Technologies (ACT) Southeastern Universities Research Association (SURA) Integrated Ocean Observing System IOOS | |||||||

