Lack of Oxygen? Hypoxia in Pacific Northwest Waters
Scientists currently link a change in wind and ocean current patterns with the appearance and persistence of Dead Zones off the coast of Oregon. We have noticed that some non-scientists have questions about the importance of other factors that may contribute to the formation of the Dead Zone. We attempt to answer a few of those questions here.
- Question #1: Are human-based nutrient inputs of fertilizer and sewage the root cause of all hypoxic Dead Zones?
- Question #2: What about overfishing? Are there enough fish off the coast of Oregon to keep blooms in check by eating plankton at the surface or eat the dead plankton on the bottom of the ocean?
- Question #3: Do underwater earthquakes, volcanoes, vents, and/or methane seeps contribute to creating the coastal dead zone in Oregon?
Question #1
Question:
Are human-based nutrient inputs of fertilizer and sewage are the root cause of all hypoxic Dead Zones?
Answer:
There are two types of events that contribute to the formation of dead zones:
- Human-based nutrient loading: dead zones in the Chesapeake Bay and the Gulf of Mexico are linked to the fertilizer and sewage inputs from agriculture and urban development
- Naturally occurring upwelling: the dead zone off the coast of Oregon and Washington is linked to unusually persistent winds that pull deep, low oxygen water closer to the coast1
Although not specifically researched, there are two contributing lines of evidence that suggest that human-based nutrient runoff is a minimal to nonexistent contributor to the formation of coastal Oregon/Washington dead zone. 1) There are fewer sources of human-based nutrients in the Pacific Northwest than the East coast, and 2) Seasonal rainfall in the Pacific Northwest brings nutrients to the ocean during the opposite season that hypoxia events occur. These issues will be addressed in order:
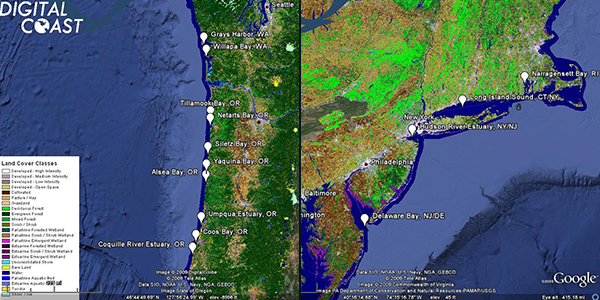
1) Land-based human activities
There are fundamental differences between the watersheds that empty into the U.S. coastal ocean waters in the Northeast and the Northwest2
Northwest | Northeast | |||
Length of coastline | 344 miles | 377 miles | ||
Number of estuary watersheds | 11 (Including Columbia River) | 4 | ||
Watershed area covered in forest | 91-98% | 21-54% | ||
Watershed area covered in agriculture | 0-5% | 6-39% | ||
Watershed area covered in urban development | 0-4% | 31-42% | ||
Population density (people per sq mile) | 8 to 93 | 1,000 to 1,529 | ||
Table modified from Brown and Ozretich, 2009 | ||||

Maps of land cover to compare the land use in the Pacific Northwest (left) and the Northeast (right). The color legend for the Northeast map is the same as the color legend in the Pacific Northwest map.
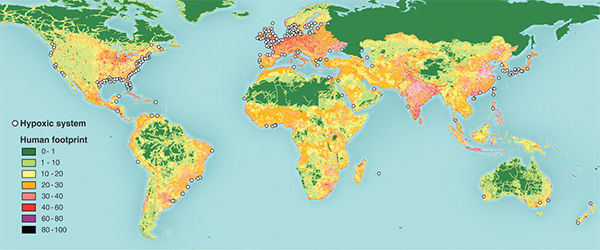
Land use is translated into the amount of human impact on the land3
- The eastern half of the country is more greatly impacted than the western half
- East coast: 92 hypoxic areas
- Gulf of Mexico: 57 hypoxic areas
- West coast: 18 hypoxic areas

This map shows the locations of scientifically validated hypoxic dead zones around the world in relation to the percentage of the human influence on the land.
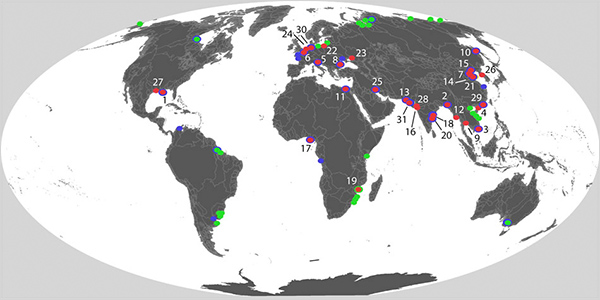
The human-based land impacts are linked to degraded coastal oceans4
- The cumulative land-based human activities in the Mississippi River watershed have made the Gulf of Mexico the most heavily impacted coastal ocean area in the world

Scientists looked at the cumulative impacts of four human activities on the world's coastal oceans:
- nutrient input from agriculture in urban settings
- organic pollutants derived from pesticides
- inorganic pollutants from urban runoff
- direct impact of human populations on coastal marine habitats
The areas of greatest impact are indicated by red dots and are ranked in order by number. The blue and green dots indicate marine ecosystems that are impacted to a lesser degree by land-based activities than that of the areas marked by the red dots.
1 Chan, F., J. A. Barth, J. Lubchenco, A. Kirincich, H. Weeks, W. T. Peterson, and B. A. Menge., 2008. Emergence of Anoxia in the California Current Large Marine Ecosystem. Science 319:920
2 Brown, C.A. and R.J. Ozretich. 2009. Coupling between the coastal ocean and Yaquina Bay, Oregon: Importance of oceanic inputs relative to other nitrogen sources. Estuaries and Coasts. 32:219-237.
3 Diaz, R.J., and R. Rosenberg. 2008. Spreading dead zones and consequences for marine ecosystems. Science. 321:926-929.
4 Halpern, B.S., C.M. Ebert, C.V. Kappel, E.M.P. Madin, F. Micheli, M. Perry, K.A. Selkoe, and S. Walbridge. 2009. Global priority areas for incorporating land-sea connections in marine conservation. Conservation Letters. 2(4):189-196.
2) Seasonal rainfall patterns
Hypoxia occurs in the summer, but the greatest nutrient loading from estuaries occurs during the winter
- November to April: about 75% of the annual coastal Pacific Northwest precipitation occurs
- River discharge follows the rainfall pattern
- The majority of the land runoff and thus land-based nutrients are exported to the ocean during the winter
- In the Yaquina Bay estuary, the nitrate in the bay during the summer is from the ocean, meaning that the river's input of nitrate into the Bay and ocean during the summer is minimal
- Because of the similarity of the majority of the watersheds in the region, we can deduce that they have similar human-based nutrient impacts
Not convinced yet? Check out some data!
There are two stations are monitoring nutrients in Oregon's estuaries: Yaquina Bay and the Lower Columbia River.
Ocean water entering the estuaries general has 30 uM of nitrate, so any values over that indicate nitrate is coming from the land. Note in the Yaquina Bay data that nitrate over 30 uM occurs during the winter, so would not contribute to the summer dead zones.
Question #2
Question:
What about overfishing? Are there enough fish off the coast of Oregon to keep blooms in check by eating plankton at the surface or eat the dead plankton on the bottom of the ocean?Where is the Hood Canal and what does it look like?
Answer:
It has not been investigated here in Oregon and Washington.
- Extensive overfishing of small schooling fish, like sardines and anchovies, has been linked to hypoxia
- In Oregon, the population of these plankton-eating fish is not reported as being overfished by the National Marine Fisheries Service
- Based on this, it can be suggested that the impact of fishing, if any, on creating the Oregon dead zone is minimal compared to the natural upwelling cycle
Question #3
Question:
Do underwater earthquakes, volcanoes, vents, and/or methane seeps contribute to creating the coastal dead zone in Oregon?
Answer:
Although no one has specifically looked at the relationship between seismic activity and hypoxia events, there is a lack of evidence that would link the two.
- There is enough oxygen at hydrothermal vents and methane seeps to support large animal communities
- Water expelled by hydrothermal vents is low in oxygen, but it quickly mixes with the surrounding water
- The clams, worms, crabs, and other life that live in these areas need oxygen just like those that live closer to shore
- Even with the input of low oxygen water, large oxygen-dependant animal communities live there
- There are no reports of increases of other gases and metals expelled by vents and seeps close to the shelf
- Vents and seeps release sulfur dioxide and other gases into the water
- If related, the upwelled, low oxygen water present close to shore during hypoxia events would have higher levels of these gases
- There are no reports that these gases have been present in the dead zone areas off the coast of Oregon
| National Observing System Partners Alliance for Coastal Technologies (ACT) Southeastern Universities Research Association (SURA) Integrated Ocean Observing System IOOS | |||||||

